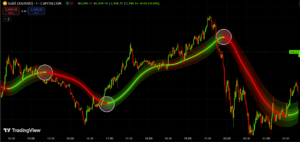
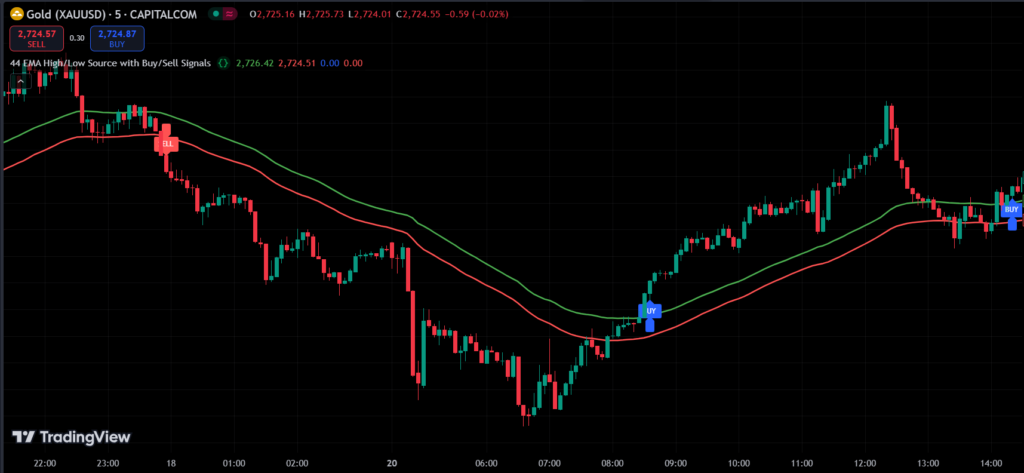
44 EMA High/Low Source with Buy/Sell Signals
					//@version=5
indicator("44 EMA High/Low Source with Buy/Sell Signals", overlay=true)

// Input for the EMA period
emaPeriod = 55

// Calculate the 44 EMA using high and low as sources
emaHigh = ta.ema(high, emaPeriod)
emaLow = ta.ema(low, emaPeriod)

// Plot the EMAs on the chart
plot(emaHigh, color=color.green, linewidth=2, title="44 EMA (High Source)")
plot(emaLow, color=color.red, linewidth=2, title="44 EMA (Low Source)")

// Persistent variables to track if buy/sell signals were already triggered
var bool buyTriggered = false
var bool sellTriggered = false

// Buy Signal Condition
buyCondition = (close > emaHigh) and (ta.crossover(low, emaHigh)) and not buyTriggered

// Sell Signal Condition
sellCondition = (close < emaLow) and (ta.crossunder(high, emaLow)) and not sellTriggered

// Reset conditions for buy/sell triggers
if (close < emaHigh)
    buyTriggered := false
if (close > emaLow)
    sellTriggered := false

if (buyCondition)
    buyTriggered := true
if (sellCondition)
    sellTriggered := true

// Plot Buy and Sell Signals
plotshape(buyCondition, title="Buy Signal", location=location.belowbar, color=color.blue, style=shape.labelup, size=size.small)
plotshape(sellCondition, title="Sell Signal", location=location.abovebar, color=color.red, style=shape.labeldown, size=size.small)

// Add text labels for Buy and Sell signals
if (buyCondition)
    label.new(bar_index, low, "BUY", color=color.blue, style=label.style_label_up, textcolor=color.white, size=size.small)

if (sellCondition)
    label.new(bar_index, high, "SELL", color=color.red, style=label.style_label_down, textcolor=color.white, size=size.small)
How to Apply an Indicator Code in Pine Script on TradingView
Follow this step-by-step guide to apply an indicator code in Pine Script on TradingView:
Step 1: Log in to TradingView
Visit TradingView and log in to your account.
If you don’t have an account, create one by clicking on Sign Up.
Step 2: Open the Chart
Click on the “Chart” option in the top navigation bar.
A default chart will load, which you can use to apply your indicator.
Step 3: Open Pine Script Editor
At the bottom of the chart, you’ll see a tab labeled “Pine Script Editor”. Click on it.
If it’s not visible, right-click on the blank area below the chart and enable “Pine Script Editor”.
Step 4: Paste Your Indicator Code
Copy the indicator code you want to use.
Paste the code into the Pine Script Editor.
Step 5: Save the Script
Click the “Save” button at the top of the editor.
Enter a name for your script (e.g., “My Custom Indicator”) and save it.
Step 6: Add the Indicator to the Chart
After saving, click the “Add to Chart” button.
The indicator will now appear on your chart.