//@version=5
indicator(shorttitle='ES Elite Signals', title='Elite Signals', overlay=true)
// --- settings
ATRperiod = input.int(defval=5, title='ATR Period', minval=1)
BBperiod = input.int(defval=21, title='Bollinger Bands Period', minval=1)
BBdeviation = input.float(defval=1.00, title='Bollinger Bands Deviation', minval=0.1, step=0.1)
UseATRfilter = input(defval=true, title='ATR Filter On/Off') // false = 0, true = 1
showsignals = input(title='Show Signals ', defval=true)
// --- end of settings
// Bollinger Bands calculation
BBUpper = ta.sma(close, BBperiod) + ta.stdev(close, BBperiod) * BBdeviation
BBLower = ta.sma(close, BBperiod) - ta.stdev(close, BBperiod) * BBdeviation
// ATR calculation
atrValue = ta.atr(ATRperiod)
// Signal initialization
var float EliteSignal = na
var int BBSignal = 0
// Determine BB signal
if (close > BBUpper)
BBSignal := 1
else if (close < BBLower)
BBSignal := -1
// Buy signal logic
if (BBSignal == 1)
if (UseATRfilter)
EliteSignal := low - atrValue
else
EliteSignal := low
if (EliteSignal < nz(EliteSignal[1]))
EliteSignal := nz(EliteSignal[1])
// Sell signal logic
if (BBSignal == -1)
if (UseATRfilter)
EliteSignal := high + atrValue
else
EliteSignal := high
if (EliteSignal > nz(EliteSignal[1]))
EliteSignal := nz(EliteSignal[1])
// Trend direction determination
var int iTrend = 0
if (nz(EliteSignal) > nz(EliteSignal[1]))
iTrend := 1
else if (nz(EliteSignal) < nz(EliteSignal[1]))
iTrend := -1
// Trend line color based on trend direction
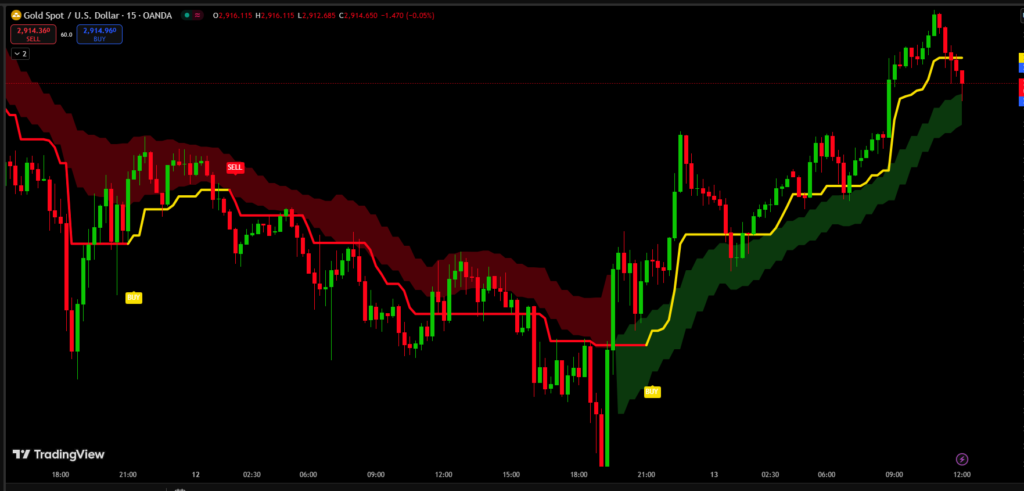
lineColor = iTrend > 0 ? #ebfc02 : #f70000
//buy & sell conditions
buy=0.0
sell=0.0
buy:=iTrend[1]==-1 and iTrend==1 ? 1 : na
sell:=iTrend[1]==1 and iTrend==-1? 1 : na
//alerts
alertcondition(sell == 1 ,title="Sell",message="Elite Signals Sell")
alertcondition(buy == 1 ,title="Buy",message="Elite Signals Buy")
alertcondition(buy == 1 or sell == 1 ,title="Signal",message="Elite Signals Signal")
// Plot the trend line and signals
plot(EliteSignal, color=lineColor, linewidth=2, title="Elite Signals")
plotshape(buy == 1 and showsignals ? EliteSignal-atrValue :na, text='BUY', style= shape.labelup, location=location.absolute, color=#ebfc02, textcolor=#050202, offset=0, transp=0,size=size.auto)
plotshape(sell == 1 and showsignals ? EliteSignal+atrValue:na, text='SELL', style=shape.labeldown, location=location.absolute, color=#f70000, textcolor=#050202, offset=0, transp=0,size=size.auto)