
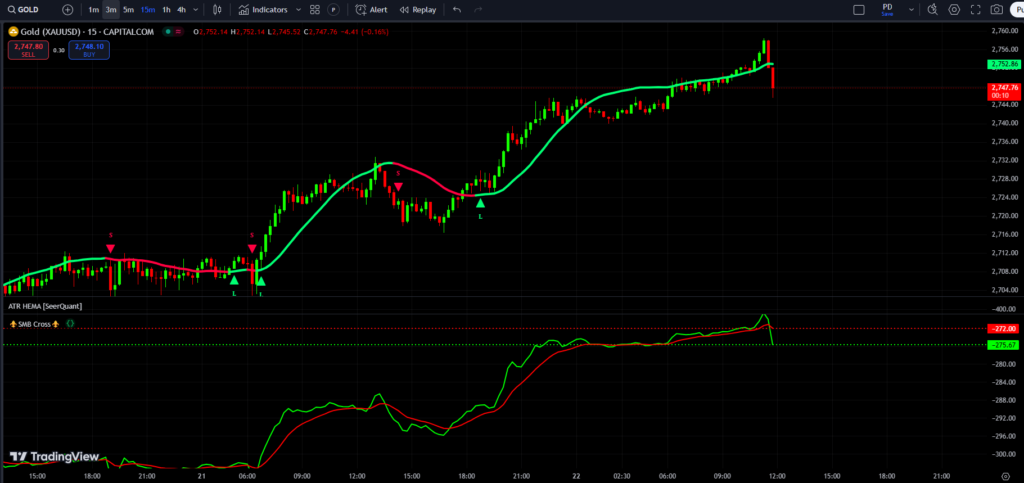
ATR HEMA & SB CROSS
					//@version=6

// This Pine Script™ code is subject to the terms of the Mozilla Public License 2.0 at https://mozilla.org/MPL/2.0/

// © SeerQuant

indicator(
 title = "ATR HEMA [SeerQuant]",
 overlay = true
 )


// INPUTS

// @param: HEMA Settings
alphaL        = input.int(title    ="Alpha Length",                    defval = 20,                  group = "======= 𝐈𝐍𝐃𝐈𝐂𝐀𝐓𝐎𝐑 𝐈𝐍𝐏𝐔𝐓𝐒 =======")
gammaL        = input.int(title    = "Gamma Length",                   defval = 20,                  group = "======= 𝐈𝐍𝐃𝐈𝐂𝐀𝐓𝐎𝐑 𝐈𝐍𝐏𝐔𝐓𝐒 =======")

// @param: ATR Settings
atrMult       = input.float(title  = "Neutral Zone Multiplier (ATR)",  defval = 0.04,  step = 0.01,  group = "======= 𝐈𝐍𝐃𝐈𝐂𝐀𝐓𝐎𝐑 𝐈𝐍𝐏𝐔𝐓𝐒 =======")
atrleng       = input.int(title    = "ATR Length",                     defval = 14,                  group = "======= 𝐈𝐍𝐃𝐈𝐂𝐀𝐓𝐎𝐑 𝐈𝐍𝐏𝐔𝐓𝐒 =======")

// @param: Calculation Source
src           = input.source(title = "Source",                         defval = hl2,                 group = "======= 𝐈𝐍𝐃𝐈𝐂𝐀𝐓𝐎𝐑 𝐈𝐍𝐏𝐔𝐓𝐒 =======")

// @param: Colour Scheme
colScheme = input.string("Default", "Color Scheme",
                         options = ["Default", "Modern", "Cool",
                                 "Alternate", "Bright"],                                             group = "======= 𝗦𝗧𝗬𝗟𝗘 𝗦𝗘𝗧𝗧𝗜𝗡𝗚𝗦 =======")

// @param: Style Settings
paint = input.bool(false, title = "Colour Candles?",                                                 group = "======= 𝗦𝗧𝗬𝗟𝗘 𝗦𝗘𝗧𝗧𝗜𝗡𝗚𝗦 =======")


//  COLORS


// @function: Color Scheme Logic
[bull, bear, neutral] = switch colScheme
    "Default"   => [#00ff73, #ff0040, #606060]
    "Modern"    => [#23d7e4, #b30f61, #707070]
    "Cool"      => [#00ffcc, #2f00ff, #505050]
    "Alternate" => [#00ff80, #ff6600, #505050]
    "Bright"    => [#e8ec00, #f200fa, #505050]


// INDICATOR CALCULATION


alpha = 2 / (alphaL + 1)
gamma = 2 / (gammaL + 1)

var float b = 0.0
var float hema = 0.0

hema := (1 - alpha) * (nz(hema[1]) + nz(b[1], src)) + alpha * src
b := (1 - gamma) * nz(b[1]) + gamma * (hema - nz(hema[1]))

atrValue = ta.atr(atrleng)
neutralThreshold = atrValue * atrMult
hemaChange = hema - hema[1]
inNeutralZone = math.abs(hemaChange) < neutralThreshold


// PLOTTING


// @description: Initialize color variables
var color hemaColor = na
var color prevColor = na

// @description: Color logic
if inNeutralZone
    hemaColor := prevColor
else
    hemaColor := hemaChange > 0 ? bull : bear

longSignal = (hemaColor == bull and prevColor == bear)
shortSignal = (hemaColor == bear and prevColor == bull)
prevColor := hemaColor

// @description: Plot the HEMA
plot(hema, title="HEMA", linewidth=4, color=hemaColor, force_overlay = true)

// @description: Option to color the bars
barcolor(paint ? hemaColor : na)

// @description: Plot long and short signals
plotshape(series = longSignal,  style = shape.triangleup,   color = bull, force_overlay = true, location = location.belowbar, text = "𝐋", textcolor = bull, size = size.small)
plotshape(series = shortSignal, style = shape.triangledown, color = bear, force_overlay = true, location = location.abovebar, text = "𝐒", textcolor = bear, size = size.small)
//@version=5
indicator("⚜️SMB Cross⚜️", overlay=false)
// محاسبه قیمتهای هیکن آشی
heikinOpen = (open + close) / 2
heikinClose = (open + high + low + close) / 4
heikinHigh = math.max(high, math.max(heikinOpen, heikinClose))
heikinLow = math.min(low, math.min(heikinOpen, heikinClose))
// تعریف متغیر برای ذخیره مقدار قبلی SMB
var float SMB_previous = na
// محاسبه SMB با استفاده از قیمتهای هیکن آشی
SMB_current = na(SMB_previous) ? 0 : SMB_previous + ((heikinClose[1] - heikinClose) / heikinClose[1]) * volume
SMB_previous := SMB_current
SMB_Real = -SMB_current
// محاسبه Moving Average از SMB_Real
length = input.int(10, title="⚜️SMB Length⚜️") // طول میانگین متحرک را به دلخواه تنظیم کنید
SMB_MA = ta.ema(SMB_Real, length)
// نمایش SMB_Real و Moving Average آن
plot(SMB_Real, color=#00ff00, trackprice = 1, linewidth = 2, title="⚜️SMB Real⚜️")
plot(SMB_MA, color=#ff0000, trackprice = 1, linewidth = 2, title="⚜️SMB EMA⚜️")
How to Apply an Indicator Code in Pine Script on TradingView
Follow this step-by-step guide to apply an indicator code in Pine Script on TradingView:
Step 1: Log in to TradingView
Visit TradingView and log in to your account.
If you don’t have an account, create one by clicking on Sign Up.
Step 2: Open the Chart
Click on the “Chart” option in the top navigation bar.
A default chart will load, which you can use to apply your indicator.
Step 3: Open Pine Script Editor
At the bottom of the chart, you’ll see a tab labeled “Pine Script Editor”. Click on it.
If it’s not visible, right-click on the blank area below the chart and enable “Pine Script Editor”.
Step 4: Paste Your Indicator Code
Copy the indicator code you want to use.
Paste the code into the Pine Script Editor.
Step 5: Save the Script
Click the “Save” button at the top of the editor.
Enter a name for your script (e.g., “My Custom Indicator”) and save it.
Step 6: Add the Indicator to the Chart
After saving, click the “Add to Chart” button.
The indicator will now appear on your chart.