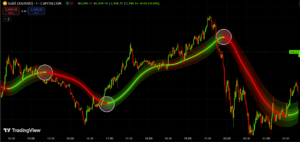
Buy/Sell Wizard Indicator
//@version=4
study("BuySell Wizard", overlay=true)
// Input and variable setup
amplitude = input(title="Amplitude", defval=6)
channelDeviation = input(title="Channel Deviation", defval=3)
showArrows = input(title="Show Arrows", defval=true)
var int trend = 0
var int nextTrend = 0
var float maxLowPrice = nz(low[1], low)
var float minHighPrice = nz(high[1], high)
var float up = 0.0
var float down = 0.0
atr2 = atr(100) / 2
dev = channelDeviation * atr2
highPrice = high[abs(highestbars(amplitude))]
lowPrice = low[abs(lowestbars(amplitude))]
highma = sma(high, amplitude)
lowma = sma(low, amplitude)
// Trend calculation
if nextTrend == 1
maxLowPrice := max(lowPrice, maxLowPrice)
if highma < maxLowPrice and close < nz(low[1], low)
trend := 1
nextTrend := 0
minHighPrice := highPrice
else
minHighPrice := min(highPrice, minHighPrice)
if lowma > minHighPrice and close > nz(high[1], high)
trend := 0
nextTrend := 1
maxLowPrice := lowPrice
if trend == 0
if not na(trend[1]) and trend[1] != 0
up := na(down[1]) ? down : down[1]
else
up := na(up[1]) ? maxLowPrice : max(maxLowPrice, up[1])
else
if not na(trend[1]) and trend[1] != 1
down := na(up[1]) ? up : up[1]
else
down := na(down[1]) ? minHighPrice : min(minHighPrice, down[1])
ht = trend == 0 ? up : down
// Neon effect colors using custom RGB values
neonColorBuy = color.new(#00FF00, 0) // Green for buy trend (neon green)
neonColorSell = color.new(#FF0000, 0) // Red for sell trend (neon red)
neonGlow1 = color.new(#00FF00, 80) // Green glow for buy trend
neonGlow2 = color.new(#FF0000, 80) // Red glow for sell trend
// Plotting neon effect layers based on trend
plot(ht, title="BuySell Wizard Neon Glow Outer", linewidth=6, color=trend == 0 ? neonGlow1 : neonGlow2)
plot(ht, title="BuySell Wizard Neon Glow Mid Outer", linewidth=5, color=trend == 0 ? neonGlow1 : neonGlow2)
plot(ht, title="BuySell Wizard Neon Glow Mid Inner", linewidth=4, color=trend == 0 ? neonGlow1 : neonGlow2)
plot(ht, title="BuySell Wizard Neon Glow Inner", linewidth=3, color=trend == 0 ? neonGlow1 : neonGlow2)
plot(ht, title="BuySell Wizard Main Line", linewidth=2, color=trend == 0 ? neonColorBuy : neonColorSell) // Main neon line color
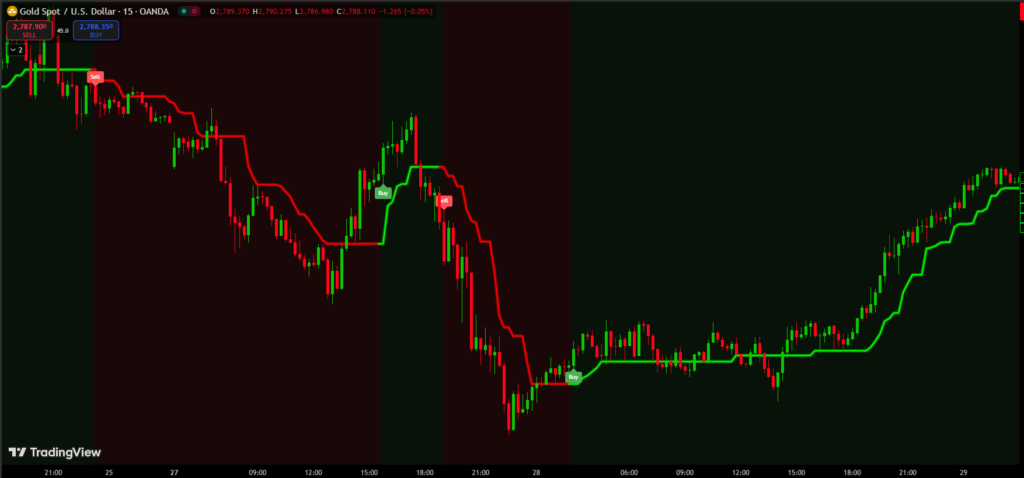
// Buy/Sell signal logic
buySignal = not na(up) and (trend == 0 and trend[1] == 1)
sellSignal = not na(down) and (trend == 1 and trend[1] == 0)
if (buySignal)
label.new(bar_index, low, text="Buy", color=color.green, textcolor=color.white, style=label.style_label_up, size=size.small)
if (sellSignal)
label.new(bar_index, high, text="Sell", color=color.red, textcolor=color.white, style=label.style_label_down, size=size.small)
// Alert conditions
alertcondition(buySignal, title="Alert: BuySell Wizard Buy", message="BuySell Wizard Buy")
alertcondition(sellSignal, title="Alert: BuySell Wizard Sell", message="BuySell Wizard Sell")
// Background Color for Trend Visualization
bgcolor(trend == 0 ? color.new(color.green, 90) : color.new(color.red, 90))
How to Apply an Indicator Code in Pine Script on TradingView
Follow this step-by-step guide to apply an indicator code in Pine Script on TradingView:
Step 1: Log in to TradingView
Visit TradingView and log in to your account.
If you don’t have an account, create one by clicking on Sign Up.
Step 2: Open the Chart
Click on the “Chart” option in the top navigation bar.
A default chart will load, which you can use to apply your indicator.
Step 3: Open Pine Script Editor
At the bottom of the chart, you’ll see a tab labeled “Pine Script Editor”. Click on it.
If it’s not visible, right-click on the blank area below the chart and enable “Pine Script Editor”.
Step 4: Paste Your Indicator Code
Copy the indicator code you want to use.
Paste the code into the Pine Script Editor.
Step 5: Save the Script
Click the “Save” button at the top of the editor.
Enter a name for your script (e.g., “My Custom Indicator”) and save it.
Step 6: Add the Indicator to the Chart
After saving, click the “Add to Chart” button.
The indicator will now appear on your chart.