
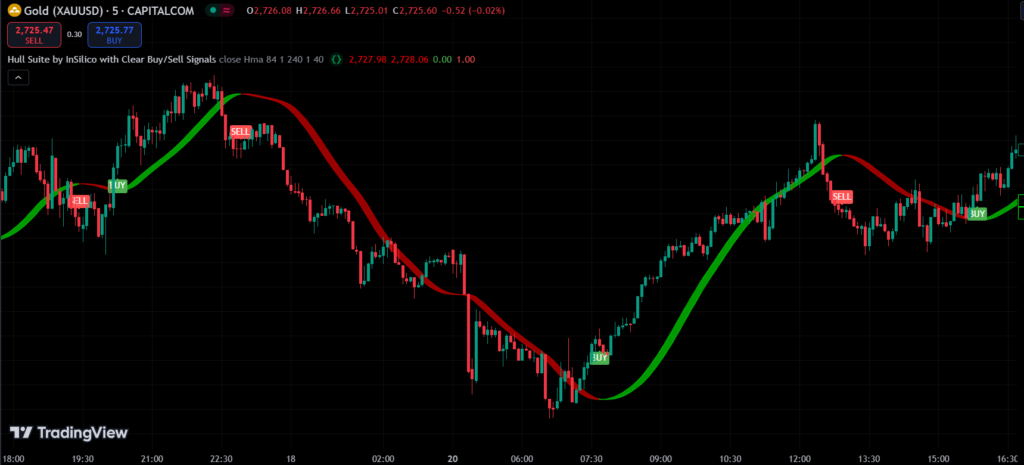
Hull Suite by InSilico with Clear Buy/Sell Signals
					//@version=4
//Basic Hull Ma Pack tinkered by InSilico
study("Hull Suite by InSilico with Clear Buy/Sell Signals", overlay=true)

//INPUT
src = input(close, title="Source")
modeSwitch = input("Hma", title="Hull Variation", options=["Hma", "Thma", "Ehma"])
length = input(84, title="Length(180-200 for floating S/R , 1000 for swing entry)")
lengthMult = input(1.0, title="Length multiplier (Used to view higher timeframes with straight band)")

useHtf = input(false, title="Show Hull MA from X timeframe? (good for scalping)")
htf = input("240", title="Higher timeframe", type=input.resolution)

switchColor = input(true, "Color Hull according to trend?")
candleCol = input(false,title="Color candles based on Hull's Trend?")
visualSwitch  = input(true, title="Show as a Band?")
thicknesSwitch = input(1, title="Line Thickness")
transpSwitch = input(40, title="Band Transparency", step=5)

//FUNCTIONS
//HMA
HMA(_src, _length) =>  wma(2 * wma(_src, _length / 2) - wma(_src, _length), round(sqrt(_length)))
//EHMA
EHMA(_src, _length) =>  ema(2 * ema(_src, _length / 2) - ema(_src, _length), round(sqrt(_length)))
//THMA
THMA(_src, _length) =>  wma(wma(_src, _length / 3) * 3 - wma(_src, _length / 2) - wma(_src, _length), _length)

//SWITCH
Mode(modeSwitch, src, len) =>
      modeSwitch == "Hma"  ? HMA(src, len) :
      modeSwitch == "Ehma" ? EHMA(src, len) :
      modeSwitch == "Thma" ? THMA(src, len/2) : na

//OUT
_hull = Mode(modeSwitch, src, int(length * lengthMult))
HULL = useHtf ? security(syminfo.ticker, htf, _hull) : _hull
MHULL = HULL[0]
SHULL = HULL[2]

//COLOR
hullColor = switchColor ? (HULL > HULL[2] ? #00ff00 : #ff0000) : #ff9800

//PLOT
///< Frame
Fi1 = plot(MHULL, title="MHULL", color=hullColor, linewidth=thicknesSwitch, transp=50)
Fi2 = plot(visualSwitch ? SHULL : na, title="SHULL", color=hullColor, linewidth=thicknesSwitch, transp=50)
alertcondition(crossover(MHULL, SHULL), title="Hull trending up.", message="Hull trending up.")
alertcondition(crossover(SHULL, MHULL), title="Hull trending down.", message="Hull trending down.")
///< Ending Filler
fill(Fi1, Fi2, title="Band Filler", color=hullColor, transp=transpSwitch)
///BARCOLOR
barcolor(color = candleCol ? (switchColor ? hullColor : na) : na)

// BUY/SELL SIGNALS
buySignal = crossover(MHULL, SHULL)
sellSignal = crossunder(MHULL, SHULL)

// Plot Buy and Sell signals with white text and clear candle position
plotshape(series=buySignal, title="Buy Signal", location=location.belowbar, color=color.green, style=shape.labelup, text="BUY", textcolor=color.white, offset=-1)
plotshape(series=sellSignal, title="Sell Signal", location=location.abovebar, color=color.red, style=shape.labeldown, text="SELL", textcolor=color.white, offset=-1)
How to Apply an Indicator Code in Pine Script on TradingView
Follow this step-by-step guide to apply an indicator code in Pine Script on TradingView:
Step 1: Log in to TradingView
Visit TradingView and log in to your account.
If you don’t have an account, create one by clicking on Sign Up.
Step 2: Open the Chart
Click on the “Chart” option in the top navigation bar.
A default chart will load, which you can use to apply your indicator.
Step 3: Open Pine Script Editor
At the bottom of the chart, you’ll see a tab labeled “Pine Script Editor”. Click on it.
If it’s not visible, right-click on the blank area below the chart and enable “Pine Script Editor”.
Step 4: Paste Your Indicator Code
Copy the indicator code you want to use.
Paste the code into the Pine Script Editor.
Step 5: Save the Script
Click the “Save” button at the top of the editor.
Enter a name for your script (e.g., “My Custom Indicator”) and save it.
Step 6: Add the Indicator to the Chart
After saving, click the “Add to Chart” button.
The indicator will now appear on your chart.