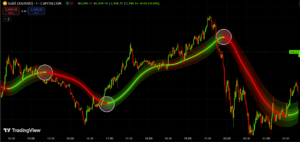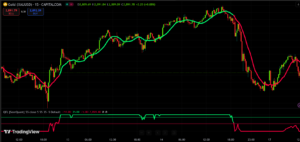
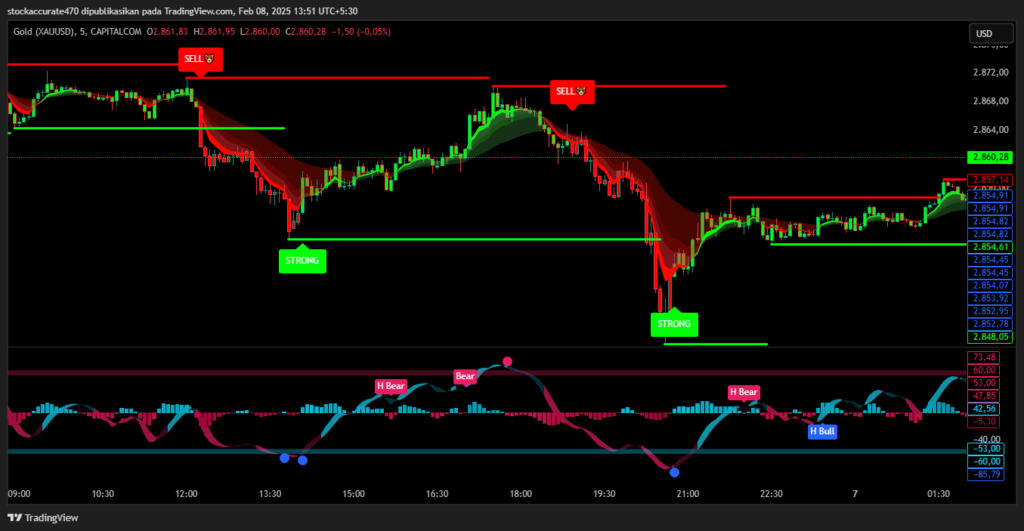
Sniper Buy/Sell Strategy
					//@version=5

indicator("Ultra BUY SELL", overlay = false)
// Inputs
src = input(close, "Source", group = "Main settings")
p = input.int(180, "Trend period", group = "Main settings", tooltip = "Changes STRONG signals' sensitivity.", minval = 1)
atr_p = input.int(155, "ATR Period", group = "Main settings", minval = 1)
mult = input.float(2.1, "ATR Multiplier", step = 0.1, group = "Main settings", tooltip = "Changes sensitivity: higher period = higher sensitivty.")
mode = input.string("Type A", "Signal mode", options = ["Type A", "Type B"], group = "Mode")
use_ema_smoother = input.string("No", "Smooth source with EMA?", options = ["Yes", "No"], group = "Source")
src_ema_period = input(3, "EMA Smoother period", group = "Source")
color_bars = input(true, "Color bars?", group = "Addons")
signals_view = input.string("All", "Signals to show", options = ["All", "Buy/Sell", "Strong", "None"], group = "Signal's Addon")
signals_shape = input.string("Labels", "Signal's shape", options = ["Labels", "Arrows"], group = "Signal's Addon")
buy_col = input(color.rgb(0, 255, 8), "Buy colour", group = "Signal's Addon", inline = "BS")
sell_col = input(color.rgb(255, 0, 0), "Sell colour", group = "Signal's Addon", inline = "BS")


// Calculations
src := use_ema_smoother == "Yes" ? ta.ema(src, src_ema_period) : src // Source;

h = ta.highest(src, p) // Highest of src p-bars back;
l = ta.lowest(src, p) // Lowest of src p-bars back.
d = h - l

ls = "" // Tracker of last signal

m = (h + l) / 2 // Initial trend line;
m := bar_index > p ? m[1] : m

atr = ta.atr(atr_p)[1] // ATR;
epsilon = mult * atr // Epsilon is a mathematical variable used in many different theorems in order to simplify work with mathematical object. Here it used as sensitivity measure.

change_up = (mode == "Type B" ? ta.cross(src, m + epsilon) : ta.crossover(src, m + epsilon)) or src > m + epsilon // If price breaks trend line + epsilon (so called higher band), then it is time to update the value of a trend line;
change_down = (mode == "Type B" ? ta.cross(src, m - epsilon) : ta.crossunder(src, m - epsilon)) or src < m - epsilon // If price breaks trend line - epsilon (so called higher band), then it is time to update the value of a trend line.
sb = open < l + d / 8 and open >= l
ss = open > h - d / 8 and open <= h
strong_buy = sb or sb[1] or sb[2] or sb[3] or sb[4]
strong_sell = ss or ss[1] or ss[2] or ss[3] or ss[4]

m := (change_up or change_down) and m != m[1] ? m : change_up ? m + epsilon : change_down ? m - epsilon : nz(m[1], m) // Updating the trend line.

ls := change_up ? "B" : change_down ? "S" : ls[1] // Last signal. Helps avoid multiple labels in a row with the same signal;
colour = ls == "B" ? buy_col : sell_col // Colour of the trend line.
buy_shape   = signals_shape == "Labels" ? shape.labelup     : shape.triangleup
sell_shape  = signals_shape == "Labels" ? shape.labeldown   : shape.triangledown


// Plottings

// Signals with label shape
plotshape(signals_shape == "Labels" and (signals_view == "All" or signals_view == "Buy/Sell") and change_up and ls[1] != "B" and not strong_buy, "Buy signal"       , color = colour, style = buy_shape , location = location.belowbar, size = size.normal, text = "BUY", textcolor = color.white, force_overlay=true)      // Plotting the BUY signal;
plotshape(signals_shape == "Labels" and (signals_view == "All" or signals_view == "Buy/Sell") and change_down and ls[1] != "S" and not strong_sell, "Sell signal"   , color = colour, style = sell_shape, size = size.normal, text = "SELL", textcolor = color.white, force_overlay=true)                                   // Plotting the SELL signal.
plotshape(signals_shape == "Labels" and (signals_view == "All" or signals_view == "Strong") and change_up and ls[1] != "B" and strong_buy, "Strong Buy signal"      , color = colour, style = buy_shape , location = location.belowbar, size = size.normal, text = "STRONG", textcolor = color.white, force_overlay=true)   // Plotting the STRONG BUY signal;
plotshape(signals_shape == "Labels" and (signals_view == "All" or signals_view == "Strong") and change_down and ls[1] != "S" and strong_sell, "Strong Sell signal"  , color = colour, style = sell_shape, size = size.normal, text = "STRONG", textcolor = color.white, force_overlay=true)                                 // Plotting the STRONG SELL signal.

// Signal with arrow shape
plotshape(signals_shape == "Arrows" and (signals_view == "All" or signals_view == "Buy/Sell") and change_up and ls[1] != "B" and not strong_buy, "Buy signal"       , color = colour, style = buy_shape , location = location.belowbar, size = size.tiny, force_overlay=true) // Plotting the BUY signal;
plotshape(signals_shape == "Arrows" and (signals_view == "All" or signals_view == "Buy/Sell") and change_down and ls[1] != "S" and not strong_sell, "Sell signal"   , color = colour, style = sell_shape, size = size.tiny, force_overlay=true)                               // Plotting the SELL signal.
plotshape(signals_shape == "Arrows" and (signals_view == "All" or signals_view == "Strong") and change_up and ls[1] != "B" and strong_buy, "Strong Buy signal"      , color = colour, style = buy_shape , location = location.belowbar, size = size.tiny, force_overlay=true) // Plotting the STRONG BUY signal;
plotshape(signals_shape == "Arrows" and (signals_view == "All" or signals_view == "Strong") and change_down and ls[1] != "S" and strong_sell, "Strong Sell signal"  , color = colour, style = sell_shape, size = size.tiny, force_overlay=true)                               // Plotting the STRONG SELL signal.

barcolor(color_bars ? colour : na) // Bar coloring


// Alerts


matype = input.string(title='MA Type', defval='EMA', options=['EMA', 'SMA'])

ma_len1 = input(title='Short EMA1 Length', defval=5)
ma_len2 = input(title='Long EMA1 Length', defval=7)
ma_len3 = input(title='Short EMA2 Length', defval=5)
ma_len4 = input(title='Long EMA2 Length', defval=34)
ma_len5 = input(title='Short EMA3 Length', defval=98)
ma_len6 = input(title='Long EMA3 Length', defval=45)
ma_len7 = input(title='Short EMA4 Length', defval=7)
ma_len8 = input(title='Long EMA4 Length', defval=11)
ma_len9 = input(title='Short EMA5 Length', defval=11)
ma_len10 = input(title='Long EMA5 Length', defval=15)

ma_offset = input(title='Offset', defval=0)
//res = input(title="Resolution", type=resolution, defval="240")

f_ma(malen) =>
    float result = 0
    if matype == 'EMA'
        result := ta.ema(src, malen)
        result
    if matype == 'SMA'
        result := ta.sma(src, malen)
        result
    result

htf_ma1 = f_ma(ma_len1)
htf_ma2 = f_ma(ma_len2)
htf_ma3 = f_ma(ma_len3)
htf_ma4 = f_ma(ma_len4)
htf_ma5 = f_ma(ma_len5)
htf_ma6 = f_ma(ma_len6)
htf_ma7 = f_ma(ma_len7)
htf_ma8 = f_ma(ma_len8)
htf_ma9 = f_ma(ma_len9)
htf_ma10 = f_ma(ma_len10)

//plot(out1, color=green, offset=ma_offset)
//plot(out2, color=red, offset=ma_offset)

//lengthshort = input(8, minval = 1, title = "Short EMA Length")
//lengthlong = input(200, minval = 2, title = "Long EMA Length")
//emacloudleading = input(50, minval = 0, title = "Leading Period For EMA Cloud")
//src = input(hl2, title = "Source")
showlong = input(false, title='Show Long Alerts')
showshort = input(false, title='Show Short Alerts')
showLine = input(false, title='Display EMA Line')
ema1 = input(true, title='Show EMA Cloud-1')
ema2 = input(true, title='Show EMA Cloud-2')
ema3 = input(true, title='Show EMA Cloud-3')
ema4 = input(true, title='Show EMA Cloud-4')
ema5 = input(true, title='Show EMA Cloud-5')

emacloudleading = input.int(0, minval=0, title='Leading Period For EMA Cloud')
mashort1 = htf_ma1
malong1 = htf_ma2
mashort2 = htf_ma3
malong2 = htf_ma4
mashort3 = htf_ma5
malong3 = htf_ma6
mashort4 = htf_ma7
malong4 = htf_ma8
mashort5 = htf_ma9
malong5 = htf_ma10

cloudcolour1 = mashort1 >= malong1 ? color.rgb(0, 255, 0) : color.rgb(255, 0, 0)
cloudcolour2 = mashort2 >= malong2 ? #4caf4f47 : #ff110047
cloudcolour4 = mashort4 >= malong4 ? #4caf4f52 : #f2364652
cloudcolour5 = mashort5 >= malong5 ? #33ff0026 : #ff000026
//03abc1

mashortcolor1 = mashort1 >= mashort1[1] ? color.olive : color.maroon
mashortcolor2 = mashort2 >= mashort2[1] ? color.olive : color.maroon
mashortcolor3 = mashort3 >= mashort3[1] ? color.olive : color.maroon
mashortcolor4 = mashort4 >= mashort4[1] ? color.olive : color.maroon
mashortcolor5 = mashort5 >= mashort5[1] ? color.olive : color.maroon


mashortline1 = plot(ema1 ? mashort1 : na, color=showLine ? mashortcolor1 : na, linewidth=1, offset=emacloudleading, title='Short Leading EMA1', force_overlay=true)
mashortline2 = plot(ema2 ? mashort2 : na, color=showLine ? mashortcolor2 : na, linewidth=1, offset=emacloudleading, title='Short Leading EMA2', force_overlay=true)
mashortline3 = plot(ema3 ? mashort3 : na, color=showLine ? mashortcolor3 : na, linewidth=1, offset=emacloudleading, title='Short Leading EMA3', force_overlay=true)
mashortline4 = plot(ema4 ? mashort4 : na, color=showLine ? mashortcolor4 : na, linewidth=1, offset=emacloudleading, title='Short Leading EMA4', force_overlay=true)
mashortline5 = plot(ema5 ? mashort5 : na, color=showLine ? mashortcolor5 : na, linewidth=1, offset=emacloudleading, title='Short Leading EMA5', force_overlay=true)

malongcolor1 = malong1 >= malong1[1] ? color.green : color.red
malongcolor2 = malong2 >= malong2[1] ? color.green : color.red
malongcolor3 = malong3 >= malong3[1] ? color.green : color.red
malongcolor4 = malong4 >= malong4[1] ? color.green : color.red
malongcolor5 = malong5 >= malong5[1] ? color.green : color.red

malongline1 = plot(ema1 ? malong1 : na, color=showLine ? malongcolor1 : na, linewidth=3, offset=emacloudleading, title='Long Leading EMA1', force_overlay=true)
malongline2 = plot(ema2 ? malong2 : na, color=showLine ? malongcolor2 : na, linewidth=3, offset=emacloudleading, title='Long Leading EMA2', force_overlay=true)
malongline3 = plot(ema3 ? malong3 : na, color=showLine ? malongcolor3 : na, linewidth=3, offset=emacloudleading, title='Long Leading EMA3', force_overlay=true)
malongline4 = plot(ema4 ? malong4 : na, color=showLine ? malongcolor4 : na, linewidth=3, offset=emacloudleading, title='Long Leading EMA4', force_overlay=true)
malongline5 = plot(ema5 ? malong5 : na, color=showLine ? malongcolor5 : na, linewidth=3, offset=emacloudleading, title='Long Leading EMA5', force_overlay=true)

fill(mashortline1, malongline1, color=cloudcolour1, title='MA Cloud1', transp=45)
fill(mashortline2, malongline2, color=cloudcolour2, title='MA Cloud2', transp=65)
fill(mashortline4, malongline4, color=cloudcolour4, title='MA Cloud4', transp=65)
fill(mashortline5, malongline5, color=cloudcolour5, title='MA Cloud5', transp=65)


leftBars = input(15, title='Left Bars ')
rightBars = input(15, title='Right Bars')
volumeThresh = input(20, title='Volume Threshold')
//
highUsePivot = fixnan(ta.pivothigh(leftBars, rightBars)[1])
lowUsePivot = fixnan(ta.pivotlow(leftBars, rightBars)[1])
r1 = plot(highUsePivot, color=ta.change(highUsePivot) ? na : #FF0000, linewidth=3, offset=-(rightBars + 1), title='Resistance', force_overlay=true)
s1 = plot(lowUsePivot, color=ta.change(lowUsePivot) ? na : #00ff0d, linewidth=3, offset=-(rightBars + 1), title='Support', force_overlay=true)

//Volume %
short = ta.ema(volume, 5)
long = ta.ema(volume, 10)
osc = 100 * (short - long) / long


//For bull / bear wicks


// This Pine Script™ code is subject to the terms of the Mozilla Public License 2.0 at https://mozilla.org/MPL/2.0/
// © divudivu600


// Developer By ALCON ALGO
//telegram : @harmonicryptosignals

//@version = 5


//indicator(shorttitle='Oscillator Vision', title='Alcon Oscillator Vision', overlay=false)
n1 = input(10, 'Channel length')
n2 = input(21, 'Average length')
reaction_wt = input.int(defval=1, title='Reaction in change of direction', minval=1)

nsc = input.float(53, 'Levels About Buys', minval=0.0)
nsv = input.float(-53, 'Levels About Sells', maxval=-0.0)

Buy_sales = input(true, title='Only Smart Buy Reversal')
Sell_sales = input(true, title='Only Smart Sell Reversal')

Histogram = input(true, title='Show Histogarm')
//Trendx = input(false, title='Show Trendx')
barras = input(true, title='Divergence on chart(Bars)')
divregbull = input(true, title='Regular Divergence Bullish')
divregbear = input(true, title='Regular Divergence Bearish')
divhidbull = input(true, title='Show Divergence Hidden Bullish')
divhidbear = input(true, title='Show Divergence Hidden Bearish')
Tags = input(true, title='Show Divergence Lable')
amme = input(false, title='Activar media movil Extra para WT')

White = #FDFEFE
Black = #000000
Bearish = #e91e62
Bullish = #18e0ff
Strong_Bullish = #2962ff
Bullish2 = #00bedc
Blue1 = #00D4FF
Blue2 = #009BBA
orange = #FF8B00
yellow = #FFFB00
LEZ = #0066FF
purp = #FF33CC

// Colouring


tf(_res, _exp, gaps_on) =>
    gaps_on == 0 ? request.security(syminfo.tickerid, _res, _exp) : gaps_on == true ? request.security(syminfo.tickerid, _res, _exp, barmerge.gaps_on, barmerge.lookahead_off) : request.security(syminfo.tickerid, _res, _exp, barmerge.gaps_off, barmerge.lookahead_off)

ha_htf = ''
show_ha = input.bool(true, "Show HA Plot/ Market Bias", group="HA Market Bias")
ha_len = input(7, 'Period', group="HA Market Bias")
ha_len2 = input(10, 'Smoothing', group="HA Market Bias")

// Calculations {
o = ta.ema(open, ha_len)
c = ta.ema(close, ha_len)
h1 = ta.ema(high, ha_len)
l1 = ta.ema(low, ha_len)

haclose = tf(ha_htf, (o + h1 + l1 + c) / 4, 0)
xhaopen = tf(ha_htf, (o + c) / 2, 0)
haopen = na(xhaopen[1]) ? (o + c) / 2 : (xhaopen[1] + haclose[1]) / 2
hahigh = math.max(h1, math.max(haopen, haclose))
halow = math.min(l1, math.min(haopen, haclose))


o2 = tf(ha_htf, ta.ema(haopen, ha_len2), 0)
c2 = tf(ha_htf, ta.ema(haclose, ha_len2), 0)
h2 = tf(ha_htf, ta.ema(hahigh, ha_len2), 0)
l2 = tf(ha_htf, ta.ema(halow, ha_len2), 0)

ha_avg = (h2 + l2) / 2
// }

osc_len = 8

osc_bias = 100 *(c2 - o2)
osc_smooth = ta.ema(osc_bias, osc_len)

sigcolor =
  (osc_bias > 0) and (osc_bias >= osc_smooth) ? color.new(Bullish, 35) :
  (osc_bias > 0) and (osc_bias < osc_smooth) ? color.new(Bullish2, 75) :
  (osc_bias < 0) and (osc_bias <= osc_smooth) ? color.new(Bearish, 35) :
  (osc_bias < 0) and (osc_bias > osc_smooth) ? color.new(Bearish, 75) :
  na
// }


nsc1 = nsc
nsc2 = nsc + 5
nsc3 = nsc + 10
nsc4 = nsc + 15
nsc5 = nsc + 20
nsc6 = nsc + 25
nsc7 = nsc + 30
nsc8 = nsc + 35
nsv1 = nsv - 5
nsv2 = nsv - 10
nsv3 = nsv - 15
nsv4 = nsv - 20
nsv5 = nsv - 25
nsv6 = nsv - 30
nsv7 = nsv - 35
nsv8 = nsv - 40


ap = hlc3
esa = ta.ema(ap, n1)
di = ta.ema(math.abs(ap - esa), n1)
ci = (ap - esa) / (0.015 * di)
tci = ta.ema(ci, n2)

wt1 = tci
wt2 = ta.sma(wt1, 4)

direction = 0
direction := ta.rising(wt1, reaction_wt) ? 1 : ta.falling(wt1, reaction_wt) ? -1 : nz(direction[1])
Change_of_direction = ta.change(direction, 1)
pcol = direction > 0 ? Strong_Bullish : direction < 0 ? Bearish : na

obLevel1 = input(60, 'Over Bought Level 1')
obLevel2 = input(53, 'Over Bought Level 2')
osLevel1 = input(-60, 'Over Sold Level 1')
osLevel2 = input(-53, 'Over Sold Level 2')

rsi = ta.rsi(close,14)
color greengrad = color.from_gradient(rsi, 10, 90, #00ddff, #007d91)
color redgrad = color.from_gradient(rsi, 10, 90, #8b002e, #e91e62)


ob1  = plot(obLevel1, color=#e91e6301)
os1 = plot(osLevel1, color=#00dbff01)
ob2 = plot(obLevel2, color=#e91e6301)
os2 = plot(osLevel2, color=#00dbff01)

p1 = plot(wt1, color=#00dbff01)
p2 = plot(wt2, color=#e91e6301)
plot(wt1 - wt2, color=wt2 - wt1 > 0 ? redgrad : greengrad, style=plot.style_columns)

// fill(p1,p2,color = wt2 - wt1 > 0 ? redgrad: greengrad) // old

fill(p1,p2,color = sigcolor) // new


fill(ob1,ob2,color = #e91e6350)
fill(os1,os2,color = #00dbff50)

midpoint = (nsc + nsv) / 2
ploff = (nsc - midpoint) / 8

BullSale = ta.crossunder(wt1, wt2) and wt1 >= nsc and Buy_sales == true
BearSale = ta.crossunder(wt1, wt2) and Buy_sales == false

Bullishh = ta.crossover(wt1, wt2) and wt1 <= nsv and Sell_sales == true
Bearishh = ta.crossover(wt1, wt2) and Sell_sales == false

plot(BullSale ? wt2[1] + ploff : na, style=plot.style_circles, color=color.new(Bearish, 0), linewidth=6, title='BuysG')
plot(BearSale ? wt2[1] + ploff : na, style=plot.style_circles, color=color.new(Bearish, 0), linewidth=6, title='SellsG')

plot(Bullishh ? wt2[1] - ploff : na, style=plot.style_circles, color=color.new(Strong_Bullish, 0), linewidth=6, title='Buys On Sale')
plot(Bearishh ? wt2[1] - ploff : na, style=plot.style_circles, color=color.new(Strong_Bullish, 0), linewidth=6, title='Sells on Sale')

//plot(Histogram ? wt1 - wt2 : na, style=plot.style_area, color=color.new(Blue2, 80), linewidth=1, title='Histograma')

//barcolor(barras == true and Bullishh == true or barras == true and Bearishh == true ? Bullish2 : na)
//barcolor(barras == true and BullSale == true or barras == true and BearSale == true ? Bearish : na)

/////// Divergence ///////

f_top_fractal(_src) =>
    _src[4] < _src[2] and _src[3] < _src[2] and _src[2] > _src[1] and _src[2] > _src[0]
f_bot_fractal(_src) =>
    _src[4] > _src[2] and _src[3] > _src[2] and _src[2] < _src[1] and _src[2] < _src[0]
f_fractalize(_src) =>
    f_top_fractal(_src) ? 1 : f_bot_fractal(_src) ? -1 : 0

fractal_top1 = f_fractalize(wt1) > 0 ? wt1[2] : na
fractal_bot1 = f_fractalize(wt1) < 0 ? wt1[2] : na

high_prev1 = ta.valuewhen(fractal_top1, wt1[2], 0)[2]
high_price1 = ta.valuewhen(fractal_top1, high[2], 0)[2]
low_prev1 = ta.valuewhen(fractal_bot1, wt1[2], 0)[2]
low_price1 = ta.valuewhen(fractal_bot1, low[2], 0)[2]

regular_bearish_div1 = fractal_top1 and high[2] > high_price1 and wt1[2] < high_prev1 and divregbear == true
hidden_bearish_div1 = fractal_top1 and high[2] < high_price1 and wt1[2] > high_prev1 and divhidbear == true
regular_bullish_div1 = fractal_bot1 and low[2] < low_price1 and wt1[2] > low_prev1 and divregbull == true
hidden_bullish_div1 = fractal_bot1 and low[2] > low_price1 and wt1[2] < low_prev1 and divhidbull == true

col1 = regular_bearish_div1 ? Bearish : hidden_bearish_div1 ? Bearish : na
col2 = regular_bullish_div1 ? Strong_Bullish : hidden_bullish_div1 ? Strong_Bullish : na

//plot(title='Divergence Bearish', series=fractal_top1 ? wt1[2] : na, color=col1, linewidth=2, transp=0)
//plot(title='Divergence Bullish', series=fractal_bot1 ? wt1[2] : na, color=col2, linewidth=2, transp=0)

plotshape(regular_bearish_div1 and divregbear and Tags ? wt1[1] + ploff * 1 : na, title='Divergence Regular Bearish', text='Bear', location=location.absolute, style=shape.labeldown, size=size.tiny, color=color.new(Bearish, 0), textcolor=color.new(White, 0))
plotshape(hidden_bearish_div1 and divhidbear and Tags ? wt1[1] + ploff * 1 : na, title='Divergence Hidden Bearish', text='H Bear', location=location.absolute, style=shape.labeldown, size=size.tiny, color=color.new(Bearish, 0), textcolor=color.new(White, 0))

plotshape(regular_bullish_div1 and divregbull and Tags ? wt1[1] - ploff * 1 : na, title='Divergence Regular Bullish', text='Bull', location=location.absolute, style=shape.labelup, size=size.tiny, color=color.new(Strong_Bullish, 0), textcolor=color.new(White, 0))
plotshape(hidden_bullish_div1 and divhidbull and Tags ? wt1[1] - ploff * 1 : na, title='Divergence Hidden Bullish', text='H Bull', location=location.absolute, style=shape.labelup, size=size.tiny, color=color.new(Strong_Bullish, 0), textcolor=color.new(White, 0))


/////// Unfazed Alerts  //////


////////////////////////////////////////////////-MISTERMOTA MOMENTUM-/////////////////////////////////////


source = input(close)
responsiveness = math.max(0.00001, input.float(0.9, minval=0.0, maxval=1.0))
periodd = input(50)
sd = ta.stdev(source, 50) * responsiveness

var worm = source
diff = source - worm
delta = math.abs(diff) > sd ? math.sign(diff) * sd : diff
worm += delta
ma = ta.sma(source, periodd)
raw_momentum = (worm - ma) / worm
current_med = raw_momentum
min_med = ta.lowest(current_med, periodd)
max_med = ta.highest(current_med, periodd)
temp = (current_med - min_med) / (max_med - min_med)
value = 0.5 * 2
value *= (temp - .5 + .5 * nz(value[1]))
value := value > .9999 ? .9999 : value
value := value < -0.9999 ? -0.9999 : value
temp2 = (1 + value) / (1 - value)
momentum = .25 * math.log(temp2)
momentum += .5 * nz(momentum[1])

//momentum := raw_momentum
signal = nz(momentum[1])
trend = math.abs(momentum) <= math.abs(momentum[1])


////////////////////////////////////////////////-GROWING/FAILING-//////////////////////////////////////////


length = input.int(title="MOM Period", minval=1, defval=14, group="MOM Settings")
srcc = input(title="MOM Source", defval=hlc3, group="MOM Settings")


txtcol_grow_above = input(#1a7b24, "Above   Grow", group="MOM Settings", inline="Above")
txtcol_fall_above = input(#672ec5, "Fall", group="MOM Settings", inline="Above")
txtcol_grow_below = input(#F37121, "Below Grow", group="MOM Settings", inline="Below")
txtcol_fall_below = input(#be0606, "Fall", group="MOM Settings", inline="Below")


ma(source, length, type) =>
    switch type
        "SMA" => ta.sma(source, length)
        "EMA" => ta.ema(source, length)
        "SMMA (RMA)" => ta.rma(source, length)
        "WMA" => ta.wma(source, length)
        "VWMA" => ta.vwma(source, length)

typeMA = input.string(title = "Method", defval = "SMA", options=["SMA", "EMA", "SMMA (RMA)", "WMA", "VWMA"], group="MA Settings")
smoothingLength = input.int(title = "Length", defval = 5, minval = 1, maxval = 100, group="MA Settings")


smoothingLine = ma(delta, smoothingLength, typeMA)


deltaText=(delta > 0 ? (delta > delta[1]? " MOM  > 0 and ▲ Growing, MOM = " + str.tostring(delta[0], "#.##") :" MOM > 0 and ▼ Falling, MOM = " + str.tostring(delta[0], "#.##") ) : (delta > delta[1] ? "MOM < 0 and ▲ Growing, MOM = " + str.tostring(delta[0], "#.##"): " MOM < 0 and ▼ Falling, MOM = " + str.tostring(delta[0], "#.##")))


oneDay = 24 * 60 * 60 * 1000
barsAhead = 3
tmf = if timeframe.ismonthly
    barsAhead * oneDay * 30
else if timeframe.isweekly
    barsAhead * oneDay * 7
else if timeframe.isdaily
    barsAhead * oneDay
else if timeframe.isminutes
    barsAhead * oneDay * timeframe.multiplier / 1440
else if timeframe.isseconds
    barsAhead * oneDay * timeframe.multiplier / 86400
else
    0


angle(_src) =>
    rad2degree = 180 / 3.14159265359  //pi
    ang = rad2degree * math.atan((_src[0] - _src[1]) / ta.atr(14))
    ang

emae = angle(smoothingLine)
emaanglestat = emae > emae[1] ? "▲  Growing": "▼  Falling"
deltaTextxxx = "MOM MA/ATR angle value is " + str.tostring(emae, "#.##") + "° and is " + emaanglestat
deltacolorxxx = emae >0 and emae >=emae[1] ? txtcol_grow_above : txtcol_fall_below
// Label
label lpt1 = label.new(time, -30, text=deltaTextxxx[0], color=deltacolorxxx, xloc=xloc.bar_time, style=label.style_label_left, textcolor=color.white, textalign=text.align_left, size=size.normal)
label.set_x(lpt1, label.get_x(lpt1) + tmf)
label.delete(lpt1[1])

txtdeltaColors  = (delta > 50 ? (delta[1] < delta ? txtcol_grow_above : txtcol_fall_above) : (delta[1] < delta ? txtcol_grow_below : txtcol_fall_below))

label ldelta1 = label.new(time, 30, text=deltaText[0], color=txtdeltaColors, xloc=xloc.bar_time, style=label.style_label_left, textcolor=color.white, textalign=text.align_left, size=size.normal)
label.set_x(ldelta1, label.get_x(ldelta1) + tmf)
label.delete(ldelta1[1])
How to Apply an Indicator Code in Pine Script on TradingView
Follow this step-by-step guide to apply an indicator code in Pine Script on TradingView:
Step 1: Log in to TradingView
Visit TradingView and log in to your account.
If you don’t have an account, create one by clicking on Sign Up.
Step 2: Open the Chart
Click on the “Chart” option in the top navigation bar.
A default chart will load, which you can use to apply your indicator.
Step 3: Open Pine Script Editor
At the bottom of the chart, you’ll see a tab labeled “Pine Script Editor”. Click on it.
If it’s not visible, right-click on the blank area below the chart and enable “Pine Script Editor”.
Step 4: Paste Your Indicator Code
Copy the indicator code you want to use.
Paste the code into the Pine Script Editor.
Step 5: Save the Script
Click the “Save” button at the top of the editor.
Enter a name for your script (e.g., “My Custom Indicator”) and save it.
Step 6: Add the Indicator to the Chart
After saving, click the “Add to Chart” button.
The indicator will now appear on your chart.