
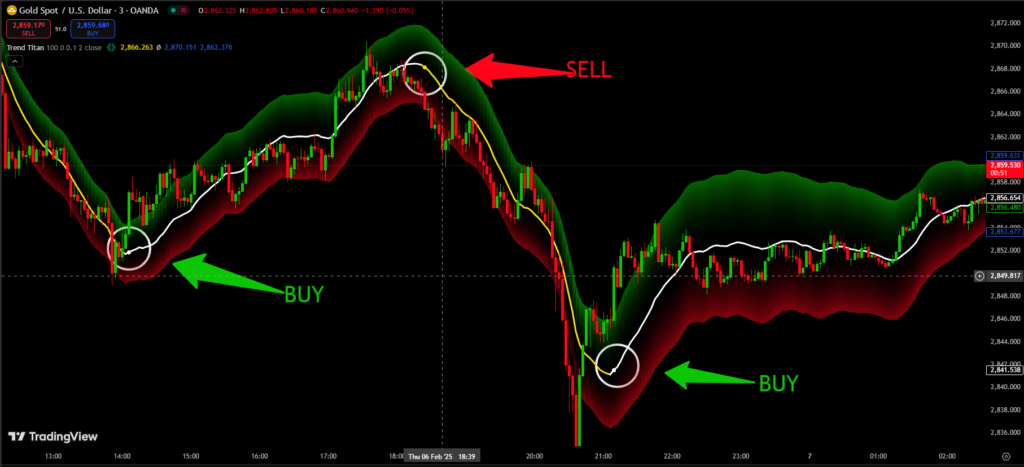
Trend Titan Tradingview Best Indicator
					//@version=5
indicator("Trend Titan", overlay = true)
//---------------------------------------------------------------------------------------------------------------------}
//Settings
//---------------------------------------------------------------------------------------------------------------------{
window = input.int(100, minval = 0)
forecast = input.int(0)
sigma = input.float(0.01, step = 0.1, minval = 0)

mult = input.float(2, 'Multiplicative Factor', minval = 0)
src = input.source(close, 'Source')

//Style
upCss = input(color.new(#5b9cf6, 50), 'Upper Extremity', group = 'Style')
dnCss = input(color.new(#e91e63, 50), 'Lower Extremity', group = 'Style')

bullCss = input(#3179f5, 'Moving Average', inline = 'ma', group = 'Style')
bearCss = input(#e91e63, ''              , inline = 'ma', group = 'Style')

//---------------------------------------------------------------------------------------------------------------------}
//Functions
//---------------------------------------------------------------------------------------------------------------------{
rbf(x1, x2, l)=> math.exp(-math.pow(x1 - x2, 2) / (2.0 * math.pow(l, 2)))

kernel_matrix(X1, X2, l)=>
    km = matrix.new<float>(X1.size(), X2.size())

    i = 0
    for x1 in X1
        j = 0
        for x2 in X2
            rbf = rbf(x1, x2, l)
            km.set(i, j, rbf)
            j += 1
        i += 1

    km

//---------------------------------------------------------------------------------------------------------------------}
//Kernel Setup
//---------------------------------------------------------------------------------------------------------------------{
var identity = matrix.new<int>(window, window, 0)
var array<float> K_row = na

if barstate.isfirst
    xtrain = array.new<int>(0)
    xtest = array.new<int>(0)

    //Build identity matrix and training array
    for i = 0 to window-1
        for j = 0 to window-1
            identity.set(i, j, i == j ? 1 : 0)

        xtrain.push(i)

    //Build testing array
    for i = 0 to window+forecast-1
        xtest.push(i)

    //Compute kernel matrices
    s = identity.mult(sigma * sigma)
    Ktrain = kernel_matrix(xtrain, xtrain, window).sum(s)
    K_inv = Ktrain.pinv()
    K_star = kernel_matrix(xtrain, xtest, window)
    K_row := K_star.transpose().mult(K_inv).row(window+forecast-1)

//---------------------------------------------------------------------------------------------------------------------}
//Moving Average
//---------------------------------------------------------------------------------------------------------------------{
var os = 0

mean = ta.sma(src, window)

//Get end point estimate
float out = na

if bar_index > window
    dotprod = 0.
    //Dot product between last K_row and training data
    for i = 0 to window-1
        dotprod += K_row.get(i) * (src[window-1 - i] - mean)

    //Output
    out := dotprod + mean

mae = ta.sma(math.abs(src - out), window) * mult
upper = out + mae
lower = out - mae

os := close > upper and out > out[1] ? 1 : close < lower and out < out[1] ? 0 : os

//---------------------------------------------------------------------------------------------------------------------}
//Plot
//---------------------------------------------------------------------------------------------------------------------{
plot_out = plot(out, 'End Point GPR', color = os ? bullCss : bearCss)

plot(os != os[1] ? out : na
  , 'Circle'
  , os ? bullCss : bearCss
  , 3
  , plot.style_circles)

plot_upper = plot(upper, 'Upper', color = na)
plot_lower = plot(lower, 'Lower', color = na)

fill(plot_upper, plot_out, out + mae, out, upCss, color.new(chart.bg_color, 100))
fill(plot_out, plot_lower, out, out - mae, color.new(chart.bg_color, 100), dnCss)

//---------------------------------------------------------------------------------------------------------------------}
How to Apply an Indicator Code in Pine Script on TradingView
Follow this step-by-step guide to apply an indicator code in Pine Script on TradingView:
Step 1: Log in to TradingView
Visit TradingView and log in to your account.
If you don’t have an account, create one by clicking on Sign Up.
Step 2: Open the Chart
Click on the “Chart” option in the top navigation bar.
A default chart will load, which you can use to apply your indicator.
Step 3: Open Pine Script Editor
At the bottom of the chart, you’ll see a tab labeled “Pine Script Editor”. Click on it.
If it’s not visible, right-click on the blank area below the chart and enable “Pine Script Editor”.
Step 4: Paste Your Indicator Code
Copy the indicator code you want to use.
Paste the code into the Pine Script Editor.
Step 5: Save the Script
Click the “Save” button at the top of the editor.
Enter a name for your script (e.g., “My Custom Indicator”) and save it.
Step 6: Add the Indicator to the Chart
After saving, click the “Add to Chart” button.
The indicator will now appear on your chart.